Navigate the OT Link Platform Dashboard
Estimated reading time: 3 minutes
Explore the OT Link Platform Dashboard features to view statistics about the OT Link Platform Converged Edge System device. The main OT Link Platform Dashboard contains the following components:
The Navigation Panel
The left side of the OT Link Platform Dashboard contains the Navigation Panel. You can access all the components, features, and configuration settings from the panel on the OT Link Platform Web User Interface.
| Icon | Name | Description |
|---|---|---|
|
|
Dashboard | The Main OT Link Platform Dashboard. Shows the CPU, Memory, and Network usage charts. |
|
|
DataHub | Activate and display connections to the cloud via OT Link Platform. Configure Workload Orchestrator Connectivity contains detailed information about DataHub. |
|
|
Integration | Activate and display Integration Connectors for database connectivity with OT Link Platform. Integration contains detailed information. |
|
|
DeviceHub | The main OT Link Platform component for setting up connections to PLC devices. DeviceHub Overview contains detailed information. |
|
|
Applications | Install new applications and display currently installed applications for enhancing OT Link Platform with databases and scripting languages. Explore the OT Link Platform Marketplace contains detailed information about Applications. |
|
|
OPC UA | Configure the built-in OPC UA server for browsing OT Link Platform devices and tags through OPC UA clients. OPC UA Overview contains detailed information. |
|
|
Flows | Enables flexible data processing, notifications, and data storage through a visual programming language. OT Link Platform Flows contains detailed information. |
|
|
System | License Activation, Version, and other information and configurations for OT Link Platform. OT Link Platform System contains detailed information on System Settings. |


Dashboard Charts
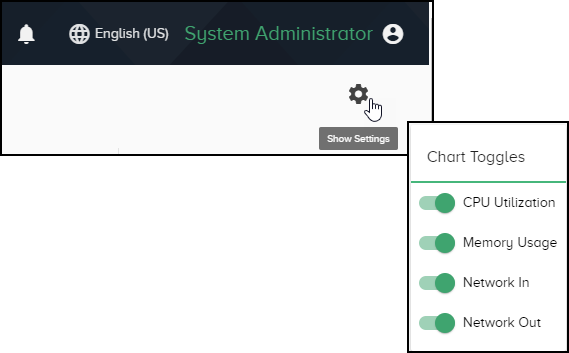
The Settings gear switches the currently displayed charts on the Dashboard.
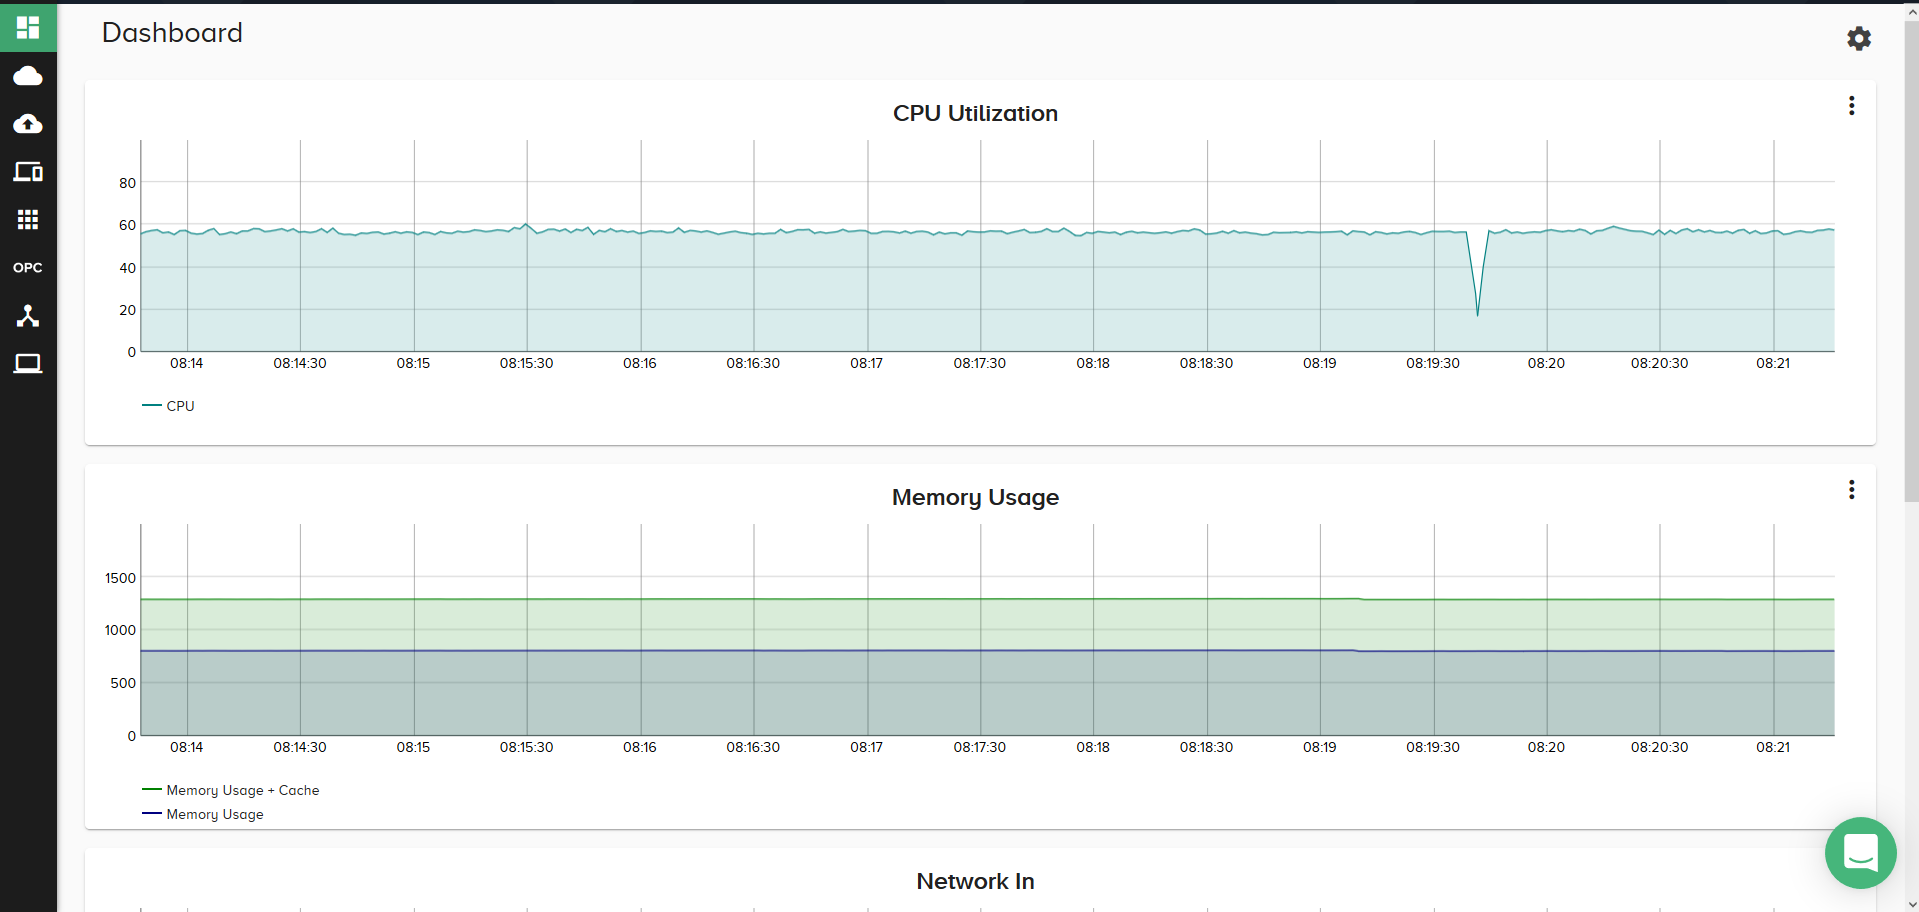
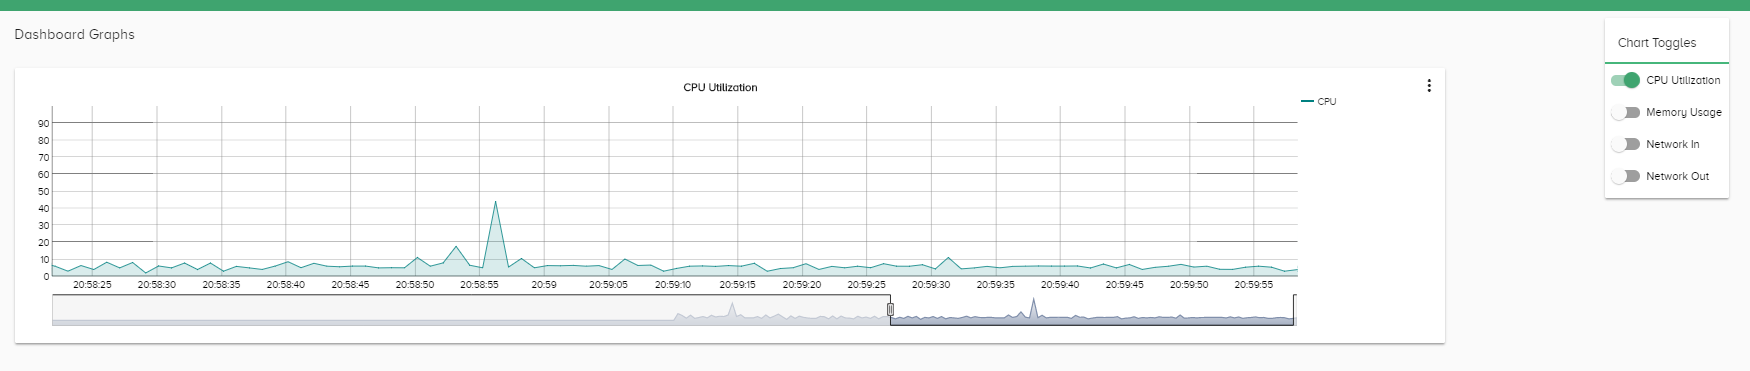
CPU Utilization - Usage of processing resources, or the amount of work handled by the Converged edge system. The y-axis represents the percentage of the CPU utilization and the x-axis represents time.
Memory Usage - Displays both cache and actual memory usage for the OT Link Platform system. The y-axis of the graph represents the memory used in megabytes and the x-axis represents time.

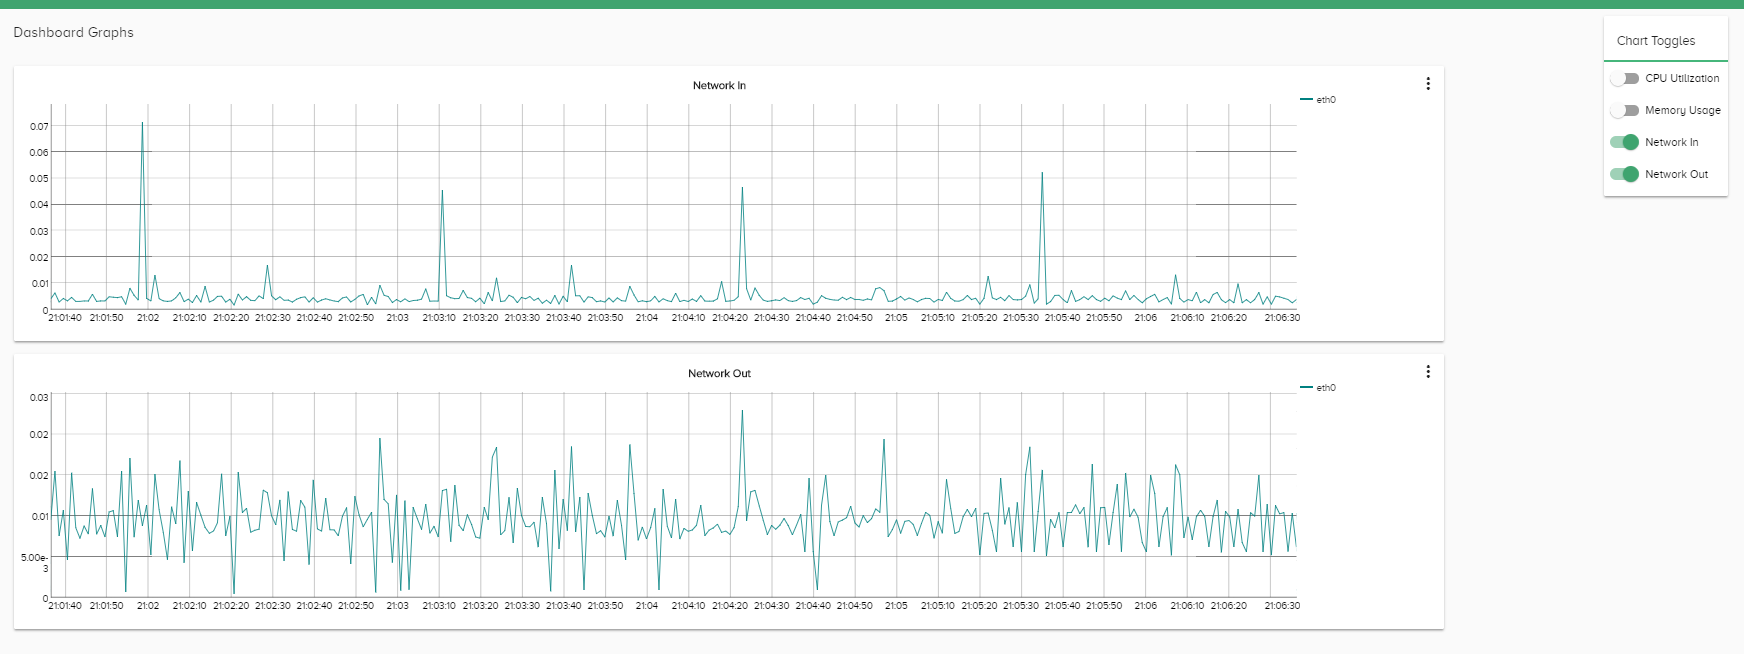
Network In/Out - Network In represents download speed while the Network Out graph represents the upload speeds. The graph displays Network Speed in mbps (megabits per second). The y-axis represents the usage and the x-axis represents time.